 |

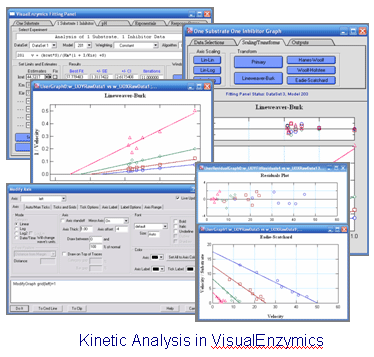
VisualEnzymics provides you with a full featured interface
for managing and analyzing your enzyme kinetic data on
either Macs or PCs. VisualEnzymics runs in OS X, Windows XP,
and Vista. Experiment files from one system are
interchangeable with the other systems. Any computer running
Igor Pro 6 will run VisualEnzymics.VisualEnzymics present you with a custom visual interface.
No more tedious wizards and results files. With
VisualEnzymics, you see curve fits in real time. All the
equations and graphs are linked. All the standard graph
transforms are programmed. Change equations and fit data
with the click of a button. Display a different data set
with the click of a button. Create a layout with the click
of a button. VisualEnzymics is built to give you interactive
control. |
 |
|
Fitting Panel l Graph Window l Report Window
l
Layout Window l
ANOVA Window l Inhibition Calculator
l Monte Carlo Fits
l Binding Calculator
|
| |
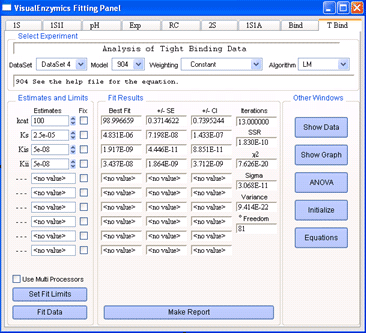 |
The Fitting Panel is the central component of
VisualEnzymics. From the Fitting Panel, you perform
data analysis and access other linked windows in
VisualEnzymics. There are nine tabs in the Fitting
Panel. Each tab takes you to the equations for a
specific type of analysis, including one substrate,
one substrate one inhibitor, pH, exponentials,
response curves, two substrate, one substrate one
activator, binding and tight binding analysis. From the Fitting Panel,
you also access data tables, graphs, ANOVA, and the
report window. Data tables allow you to enter your
kinetic data in terms of substrate, inhibitor,
activator, velocity, and standard deviation of the velocity.
Data tables are directly linked to the Fitting
Panel. The graph window displays your kinetic data
and gives you control over how you view the results
of your analysis. Graphs are automatically linked to
the Fitting Panel. The Report window gives you a
record of the statistics for each fit. You can print
out the results from the optimized fit from the
report window. The layout window provides a blank
canvas for you to compose publication quality
figures from multiple graphs of different data sets.
|
|
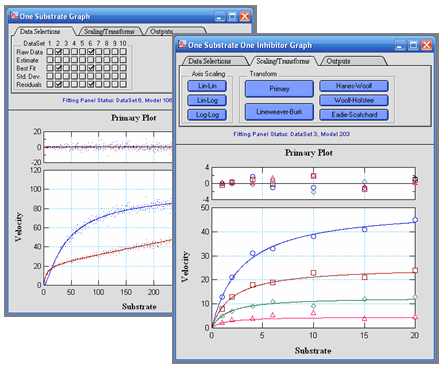
VisualEnzymics supports a graph window for each
type of analysis in the Fitting Panel. Each graph
window provides an interactive visualization of your
analysis. Since there are nine tabs corresponding to
the nine types of analysis in VisualEnzymics, there
are nine graph windows linked to the Fitting Panel.
Each graph window displays up to 10 data sets and
contains three tabs to control the data display. The
data selection tab provides controls to display the
raw data, the fit estimate curve, the final fit
curve, the error bars, and the residuals from the
individual fits. The scaling/transform tab provides
one-click buttons to scale data on linear or log
scales, or to generate automatic data transforms to
Lineweaver-Burk, Hanes-Woolf, Woolf-Hofstee, or
Eadie-Scatchard formats. The outputs tab offers
one-click buttons to generate independent copies of
the graph that are not linked to the Fitting Panel.
An unlimited number of independent graphs can be
generated from the graph window, and each can be
customized for export to publication or electronic
presentation programs. You have complete control
over all the graphic elements of independent graphs.
|
 |
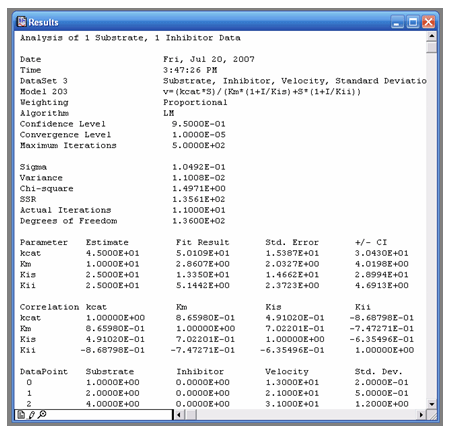 |
VisualEnzymics provides a report window to record
the results of data fits to various equations. After
fitting data to a kinetic equation, click the report
button to generate the statistical output for the
fit. The report will include the parameter settings
of the fit, the initial parameter estimates, the
final fitted parameters, the standard error and
confidence interval for the parameters, the
correlation matrix, and a copy of the original data.
From this record you can always go back and recreate
the fit, if necessary. The report can be printed for
hardbound notebooks, or you can copy and paste
reports into other programs. Alternatively, you can
copy and paste fit results into a VisualEnzymics
layout along with the final graph including the best
fitting model line. The report window is generated
in an Igor Pro notebook window that functions like
all other notebook windows in Igor Pro, i.e. as a
full fledged document editor. The notebook window
can be named and saved as a separate file. Later it
can be opened as part of any VisualEnzymics
experiment. Also, graphs and tables can be pasted
into the notebook window, as well as images or
graphics from any outside source. The report window
can be used to provide full documentation of the
experiment, including data, results, graphs,
procedures, and discussion. |
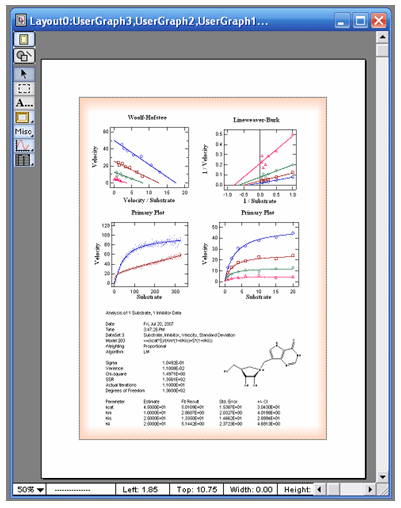
VisualEnzymics includes automatic layout windows to
combine graphs and statistical output from data
fits. The output tab in the graph windows provides
one click buttons to generate a basic layout that
includes the current graph and residuals plot from
the graph window. From this basic layout, additional
graphs and text can be added to create a visual
record of the experimental results. Any independent
graph that has been generated from the graph window
can be added to the layout. All VisualEnzymics
graphs that are included in a layout are
automatically updated whenever you change anything
in the original graph, including colors, text
sizing, symbol sizing, and annotations. Images or
graphics from other programs can be pasted into the
layout. Each layout page has a graphics layer and a
drawing layer. The graphics layer can contain
graphs, tables, and text from VisualEnzymics. The
drawing layer can be used to create elements with
the built-in drawing tools. Objects in the layout
can be positioned precisely with the alignment
guides that display object coordinates as they are
moved within the layout. Layouts can be printed for
hardbound notebooks, or can be exported as graphic
objects to presentation programs or publishable
documents. Layouts can be closed and saved.
VisualEnzymics records a layout macro to recreate
the layout and all its style elements. Saved layouts
can be used as style macros for new layouts by
opening a saved layout, and replacing the graphs in
the layout with new graphs. An unlimited number of
layouts can be saved in VisualEnzymics. |
|
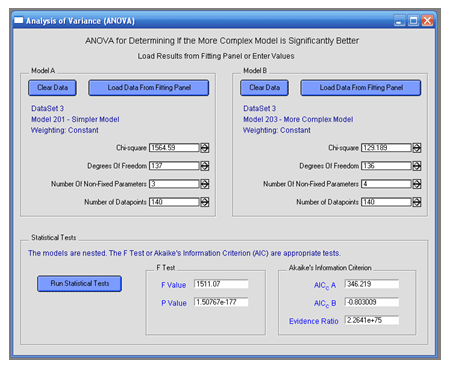 |
VisualEnzymics offers ANOVA for comparison of two
model fits to the same kinetic data. ANOVA provides
a method for determining whether or not a more
complex model yields a significantly better fit to
your data than a simpler model. After fitting your
data to one model, you can transfer the fit
statistics to the ANOVA panel under the section
labeled Model A. Then return to the Fitting Panel,
select a more complex model with more parameters,
and fit the data to the more complex model. Usually,
a more complex model with more parameters will give
you a slightly better fit. The question is whether
or not the improvement means that the more complex
model is the true model. After fitting the data,
transfer the fit statistics to the ANOVA panel under
the section labeled Model B. Then run the F test to
compare nested models, and the Akaike Information
Criteria to compare non-nested models. The F test
will yield a p value that provides the level of
significance for any improvement in the fit to the
more complex model. The lower the p value, the more
likely it is that the more complex model represents
the true kinetic model. For non-nested models, the
smaller AIC value indicates which model is likely to
be the true model.
|
|
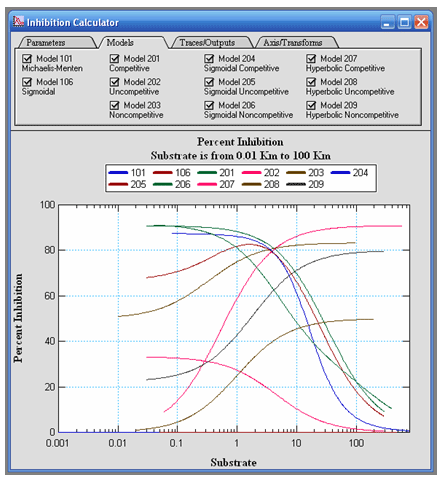
VisualEnzymics provides you with a unique inhibition
calculator that calculates the percent inhibition
for seven different steady state inhibition models
given a set of inhibition constants and reactant
concentrations. When you design an enzyme inhibition
experiment, you must select inhibitor concentrations
that will yield significant enzyme inhibition over
the range of substrate concentrations in the
experiment. The inhibition calculator was created to
help you design these experiments. For instance, if
you suspect that a potential inhibitor may yield
competitive inhibition, and you know the kcat and Km
for your enzyme, you can calculate the degree of
inhibition for any combination of Ki and inhibitor
concentration over a range of substrate
concentrations. This determines whether you might
need more or less inhibitor in your experiment to
observe significant inhibition at a specific Ki. By
entering the same Ki and inhibitor concentration for
various inhibition mechanisms, you can compare the
potential inhibition profiles for other mechanisms.
This type of comparison also is important for
experimental design in testing large chemical
libraries, sometimes up to a million compounds, in
drug discovery. Since the type of potential
inhibition is unknown for any compound in the
library, the design of the experiment will be
weighted to detecting certain types of inhibition at
the chosen substrate and inhibitor concentration. In
the design of the experiment, if you assume that you
want to be able to detect competitive inhibitors
with a Ki of 10 uM or less, and that your assay
signal window will reliably detect 50% inhibition or
greater, the inhibition calculator will calculate
the substrate concentration needed to achieve this
level of inhibition. This can reveal hidden
technical problems, and can lead to more effective
experimental designs. |
 |
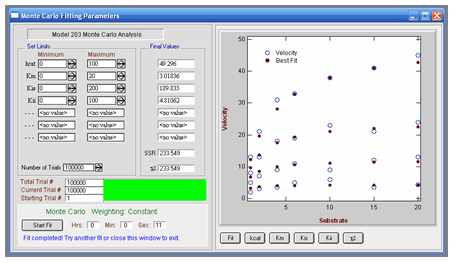 |
VisualEnzymics provides a Monte Carlo algorithm for
brute force data fitting when the kinetic parameter
estimates are largely unknown. Finding good initial
parameter estimates often is easy for simple kinetic
models with only two or three parameters. For more
complex models, however, finding good initial
estimates may be difficult, and the standard
Levenberg-Marquardt fitting algorithm may fail to
converge. In this case, the Monte Carlo method can
be used to test millions of random parameter
combinations in a matter of a few seconds or
minutes. The parameter bounds then can be narrowed
and another round of Monte Carlo optimization can be
performed to refine the parameters. With several
rounds of optimization, good initial estimates can
be obtained for use with the Levenberg-Marquardt
fitting algorithm. The Monte Carlo method also may
be used to check whether or not the Levenberg-Marquardt
algorithm has found a true minimum in the fit.
|
|
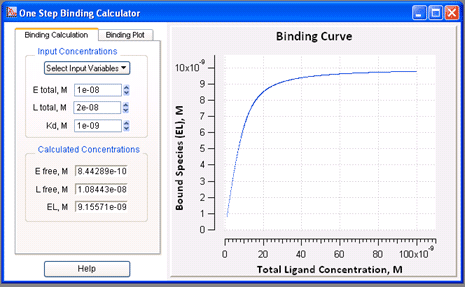
VisualEnzymics provides a binding calculator for
calculating the concentrations of free and bound
species in a one step binding reaction when at least
three of the species concentrations are known, or
two species and the Kd are known . The calculator
also provides a graph of the binding curve over any
specified range of ligand concentrations. The
calculator can be used to plan binding experiments
by entering various possibilities for the Kd, the
enzyme concentration, and the ligand concentration.
The calculated binding curve will show the shape of
the curve, and will demonstrate whether or not the
potential experimental conditions will yield binding
saturation. By varying the input parameters, it is
possible to visualize the effects of increasing or
decreasing the enzyme concentration, or to see the
effects of varying any of the species concentrations
in a one step binding mechanism.
|
 |
|
 |
