 |

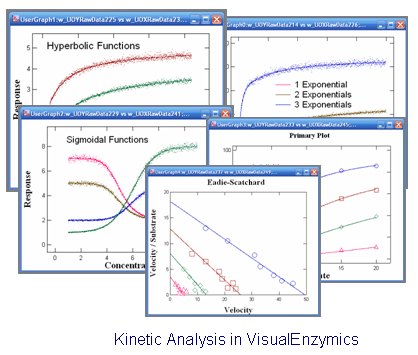
VisualEnzymics offers analysis for nine types of enzyme
binding and
kinetic data, and includes 98 model equations:
- one substrate rate saturation data
- one substrate one inhibitor data
- pH rate profiles
- exponential data
- dose response data
- two substrate data
- one substrate one activator data
- binding data
- tight binding data
Each analysis module holds up to 10 separate data sets
and each module has its own graph window with specially
formatted graphs that match the type of analysis. All data
sets can be graphed individually, or multiple data sets can
be overlaid in a single graph. Estimates and fit curves are
automatically updated and linked to each graph window. |
 |
One Substrate l One Substrate One Inhibitor l
pH l
Exponential l Dose Response
Two Substrate l
One Substrate One
Activator l
Binding l
Tight Binding |
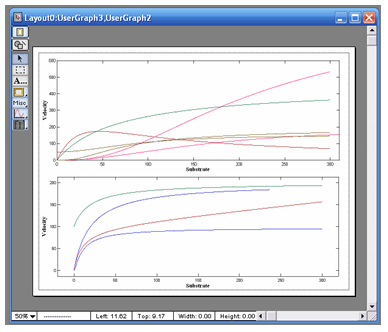 |
VisualEnzymics provides 10 equations for fitting steady state rate
saturation profiles. These include Michaelis-Menten,
Michaelis-Menton plus offset, Michaelis-Menten plus
linear phase, Hill, Hill plus offset, substrate
inhibition, two site, two/one, sigmoid, and cubic.
These equations describe a variety of hyperbolic and
sigmoidal saturation profiles, and can be fitted to
almost any type of rate saturation data. The
equations all contain two, three, or four
parameters. Parameters can be floated or
individually held constant during fitting. Data can
be weighted four different ways, including constant
weighting, proportional weighting, between constant
and proportional, or by standard deviation. You can
choose one of four different fitting algorithms,
including Levenberg-Marquardt, Levenberg-Marquardt
Robust, Monte Carlo, and Monte Carlo Robust.
|
|
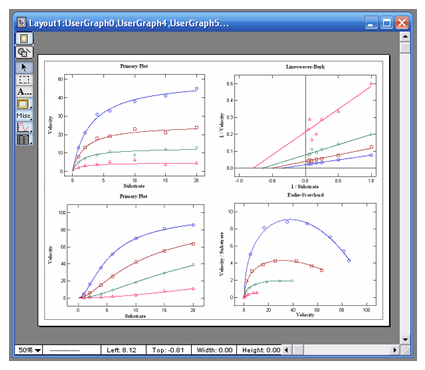
VisualEnzymics provides nine equations for fitting
steady state inhibition data. These include
competitive, noncompetitive, uncompetitive,
hyperbolic competitive, hyperbolic noncompetitive,
hyperbolic uncompetitive, sigmoidal competitive,
sigmoidal noncompetitive, and sigmoidal
uncompetitive. These equations will fit inhibition
mechanisms for Michaelis-Menten type enzyme
kinetics, and for enzymes displaying cooperative
behavior. Enter data for an inhibition experiment as
substrate concentration, inhibitor concentration,
velocity, and standard deviation of the velocity.
VisualEnzymics will automatically parse the data
according to inhibitor concentration, and plot your
results as groups of data at each inhibitor
concentration. One click buttons will generate
automatic data transforms to Lineweaver-Burk,
Hanes-Woolf, Woolf-Hofstee, or Eadie-Scatchard
formats. Graphs can be exported in 5 different
graphic formats for electronic presentations or
publication in journals. |
 |
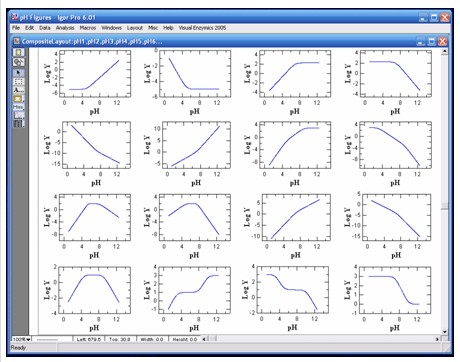 |
VisualEnzymics provides 16 pH rate profile equations
for fitting the pH dependence of binding or kinetic
parameters. All enzymes and proteins are sensitive to protons, and the variation
of reaction parameters as a function of pH yields
information about the titratable groups that
participate in binding and catalysis. These
reactions may involve acidic or basic groups, and
may yield various curve shapes as a function of pH.
VisualEnzymics provides equations describing single
or multiple inflection point pH titration curves.
Data may be plotted as Y versus pH, or Log Y versus
pH. Since pH dependence plots typically involve
parameter variation over several orders or
magnitude, VisualEnzymics offers proportional
weighting to achieve more accurate fits to data at
the extreme of the pH profile. Data may be fitted
with either the Levenberg-Marquardt or Monte Carlo
fitting algorithms. Multiple data plots can be
overlaid on the same graph to compare data from
different experiments. Plots can be combined in page
layouts for publication or lab notebooks.
|
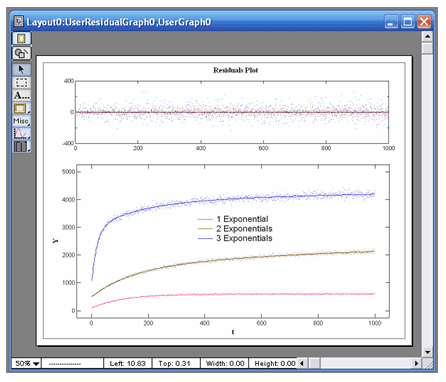
VisualEnzymics provides 24 equations for fitting
exponential data. There are eight equations for
single exponential data plus baseline, eight
equations for the sum of two exponentials plus
baseline, and eight equations for the sum of three
exponentials plus baseline. The exponential
equations will fit any variety of curve shape that
follows exponential behavior. Exponential behavior
may derive from transient kinetics in the form of
response versus time data, or may derive from
physical processes such as radioactive decay. All
fits yield the observed rate constant and the
amplitude of the exponential. When the initial
estimates of the rate constants are unknown, the
data can be fitted by the Monte Carlo method to
obtain good initial estimates. The fit then can be
optimized further by using the initial estimates in
the Levenberg-Marquart fitting algorithm. |
|
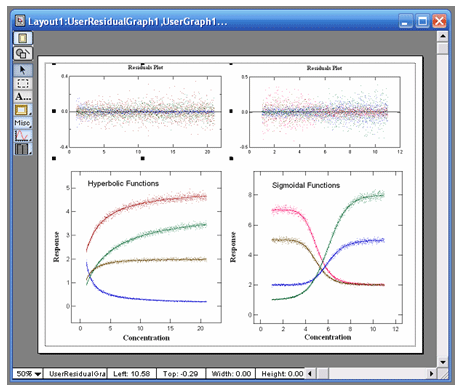 |
VisualEnzymics provides eleven equations for fitting
dose response data. These types of equations can be
used to fit activity versus ligand concentration
data when the enzyme has not been purified from a
more complex biochemical system, or where the
response mechanism is unknown, or where the response
depends on biochemical interactions beyond the
enzyme itself. These equations provide three, four,
and five parameter logistic fits. Logistic equations
yield the minimum, maximum, half-saturation point,
slope of the inflection point, and skewness of a
dose dependent response. The shapes of these curves
can be hyperbolic or sigmoidal in decreasing or
increasing direction. Fits to these equations will
yield the fitted parameters and standard error of
the parameters, as well as the user-specified
confidence interval.
|
|
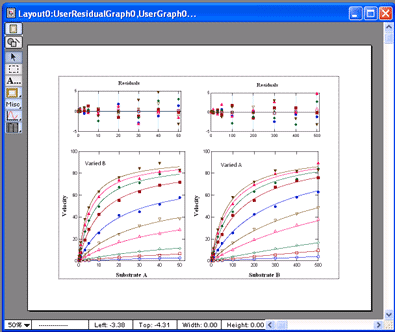
VisualEnzymics provides seven equations for
fitting two substrate steady state rate saturation
profiles. These include Ordered Bi Uni, Random Bi
Bi, Random Bi Bi with Product Inhibition, Random Bi
Bi with Substrate Inhibition, Ping Pong, Ping Pong
with Competitive Substrate Inhibition , and Ping
Pong with Double Competitive Substrate Inhibition.
The fitting algorithm fits data at all combinations
of Substrate A and Substrate B simultaneously. The
graph window automatically plots data as either
velocity versus Substrate A at fixed concentrations
of Substrate B, or as velocity versus Substrate B at
fixed concentrations of Substrate A. Data are
automatically sorted by substrate concentration and
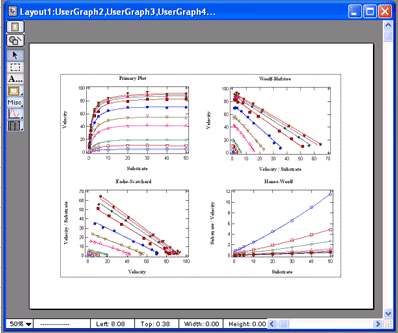
are plotted as individual groups of data. Each graph
can be transformed to Lineweaver-Burk, Hanes-Woolf,
Woof-Hofstee, or Eadie-Scatchard formats. All graphs
can be added to layouts or exported to electronic
presentation programs.
|
 |
 |
VisualEnzymics provides eight equations for
fitting one substrate one activator steady state
rate saturation profiles. These equations derive
from models where a metal ion is the activator, and
where the metal ion can combine with the enyzyme,
the substrate, or both, and activate the enzyme.
However, the form of the equations can represent any
activator that combines to form the activated
species. The models include various types of
non-essential and essential activation.
The fitting algorithm fits data at all combinations
of substrate and activator simultaneously. Data are
automatically sorted by activator concentration and
are plotted as individual groups of data. Each graph
can be transformed to Lineweaver-Burk, Hanes-Woolf,
Woof-Hofstee, or Eadie-Scatchard formats. All graphs
can be added to layouts or exported to electronic
presentation programs.
|
|
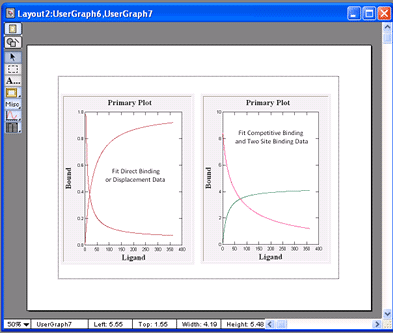
VisualEnzymics provides eight equations for
fitting equilibrium ligand binding data. These
include both a simple hyperbolic one step binding
equation and a quadratic equation for one step
binding. The quadratic equation is available in
molar binding terms and in spectroscopic terms based
on the molar extinction coefficient of the bound
complex. VisualEnzymics also includes two equations
for one site competitive binding, which can be used
to fit cases where one ligand with a measurable
signal is used to displace a second ligand that has
no intrinsic binding signal. The program also has
three equations to fit two site binding where one
ligand bindings to two sites with different
affinity. The two site equation is provided in three
forms for fitting to data based on the extinction
coefficient, data based on fluorescence titrations,
and data based on radio-ligand titrations. The
competitive and two site binding equations fit to
the root of a general cubic equation, and will fit
hyperbolic and non-hyperbolic curve shapes. Each
graph can be transformed to Lineweaver-Burk,
Hanes-Woolf, Woof-Hofstee, or Eadie-Scatchard
formats. All graphs can be added to layouts or
exported to electronic presentation programs.
|
 |
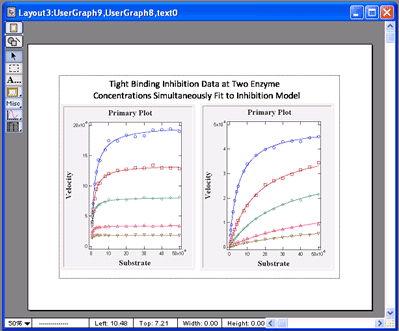 |
VisualEnzymics provides four equations for
fitting tight binding inhibition data. Tight binding
inhibition occurs when the Kd for inhibitor binding
is approximately the same as the enzyme
concentration in the experiment. This leads to
significant depletion of the free inhibitor
concentration, and special quadratic equations must
be used to describe the inhibition data correctly.
VisualEnzymics provides the correct quadratic form
of the equations for competitive, noncompetitive,
uncompetitive, and mixed tight binding inhibition.
Also, it provides the ability to perform global
tight binding inhibition analysis on data obtained
at different enzyme concentrations. Varying the
enzyme concentration is the most effective way to
demonstrate the presence of tight binding
inhibition, and to demonstrate that the inhibition
constant changes as the enzyme concentration
changes. The global fitting capability in
VisualEnzymics simultaneously fits the data at all
enzyme concentrations, and provides the true
inhibition constant for the inhibitor.
|
|
 |
